
 Data from the CRISP instrument at the Swedish 1-meter Solar Telescope
on La Palma show the presence of downflows in a sunspot penumbra. The
results are published in Science Express. The authors
are: Göran B. Scharmer, Vasco M.J. Henriques, Dan Kiselman, (all from
the Institute for Solar
Physics of the Royal Swedish Academy of Sciences and
the Department of Astronomy at
Stockholm University), and Jaime de la Cruz
Rodríguez (University of
Oslo).
Data from the CRISP instrument at the Swedish 1-meter Solar Telescope
on La Palma show the presence of downflows in a sunspot penumbra. The
results are published in Science Express. The authors
are: Göran B. Scharmer, Vasco M.J. Henriques, Dan Kiselman, (all from
the Institute for Solar
Physics of the Royal Swedish Academy of Sciences and
the Department of Astronomy at
Stockholm University), and Jaime de la Cruz
Rodríguez (University of
Oslo).
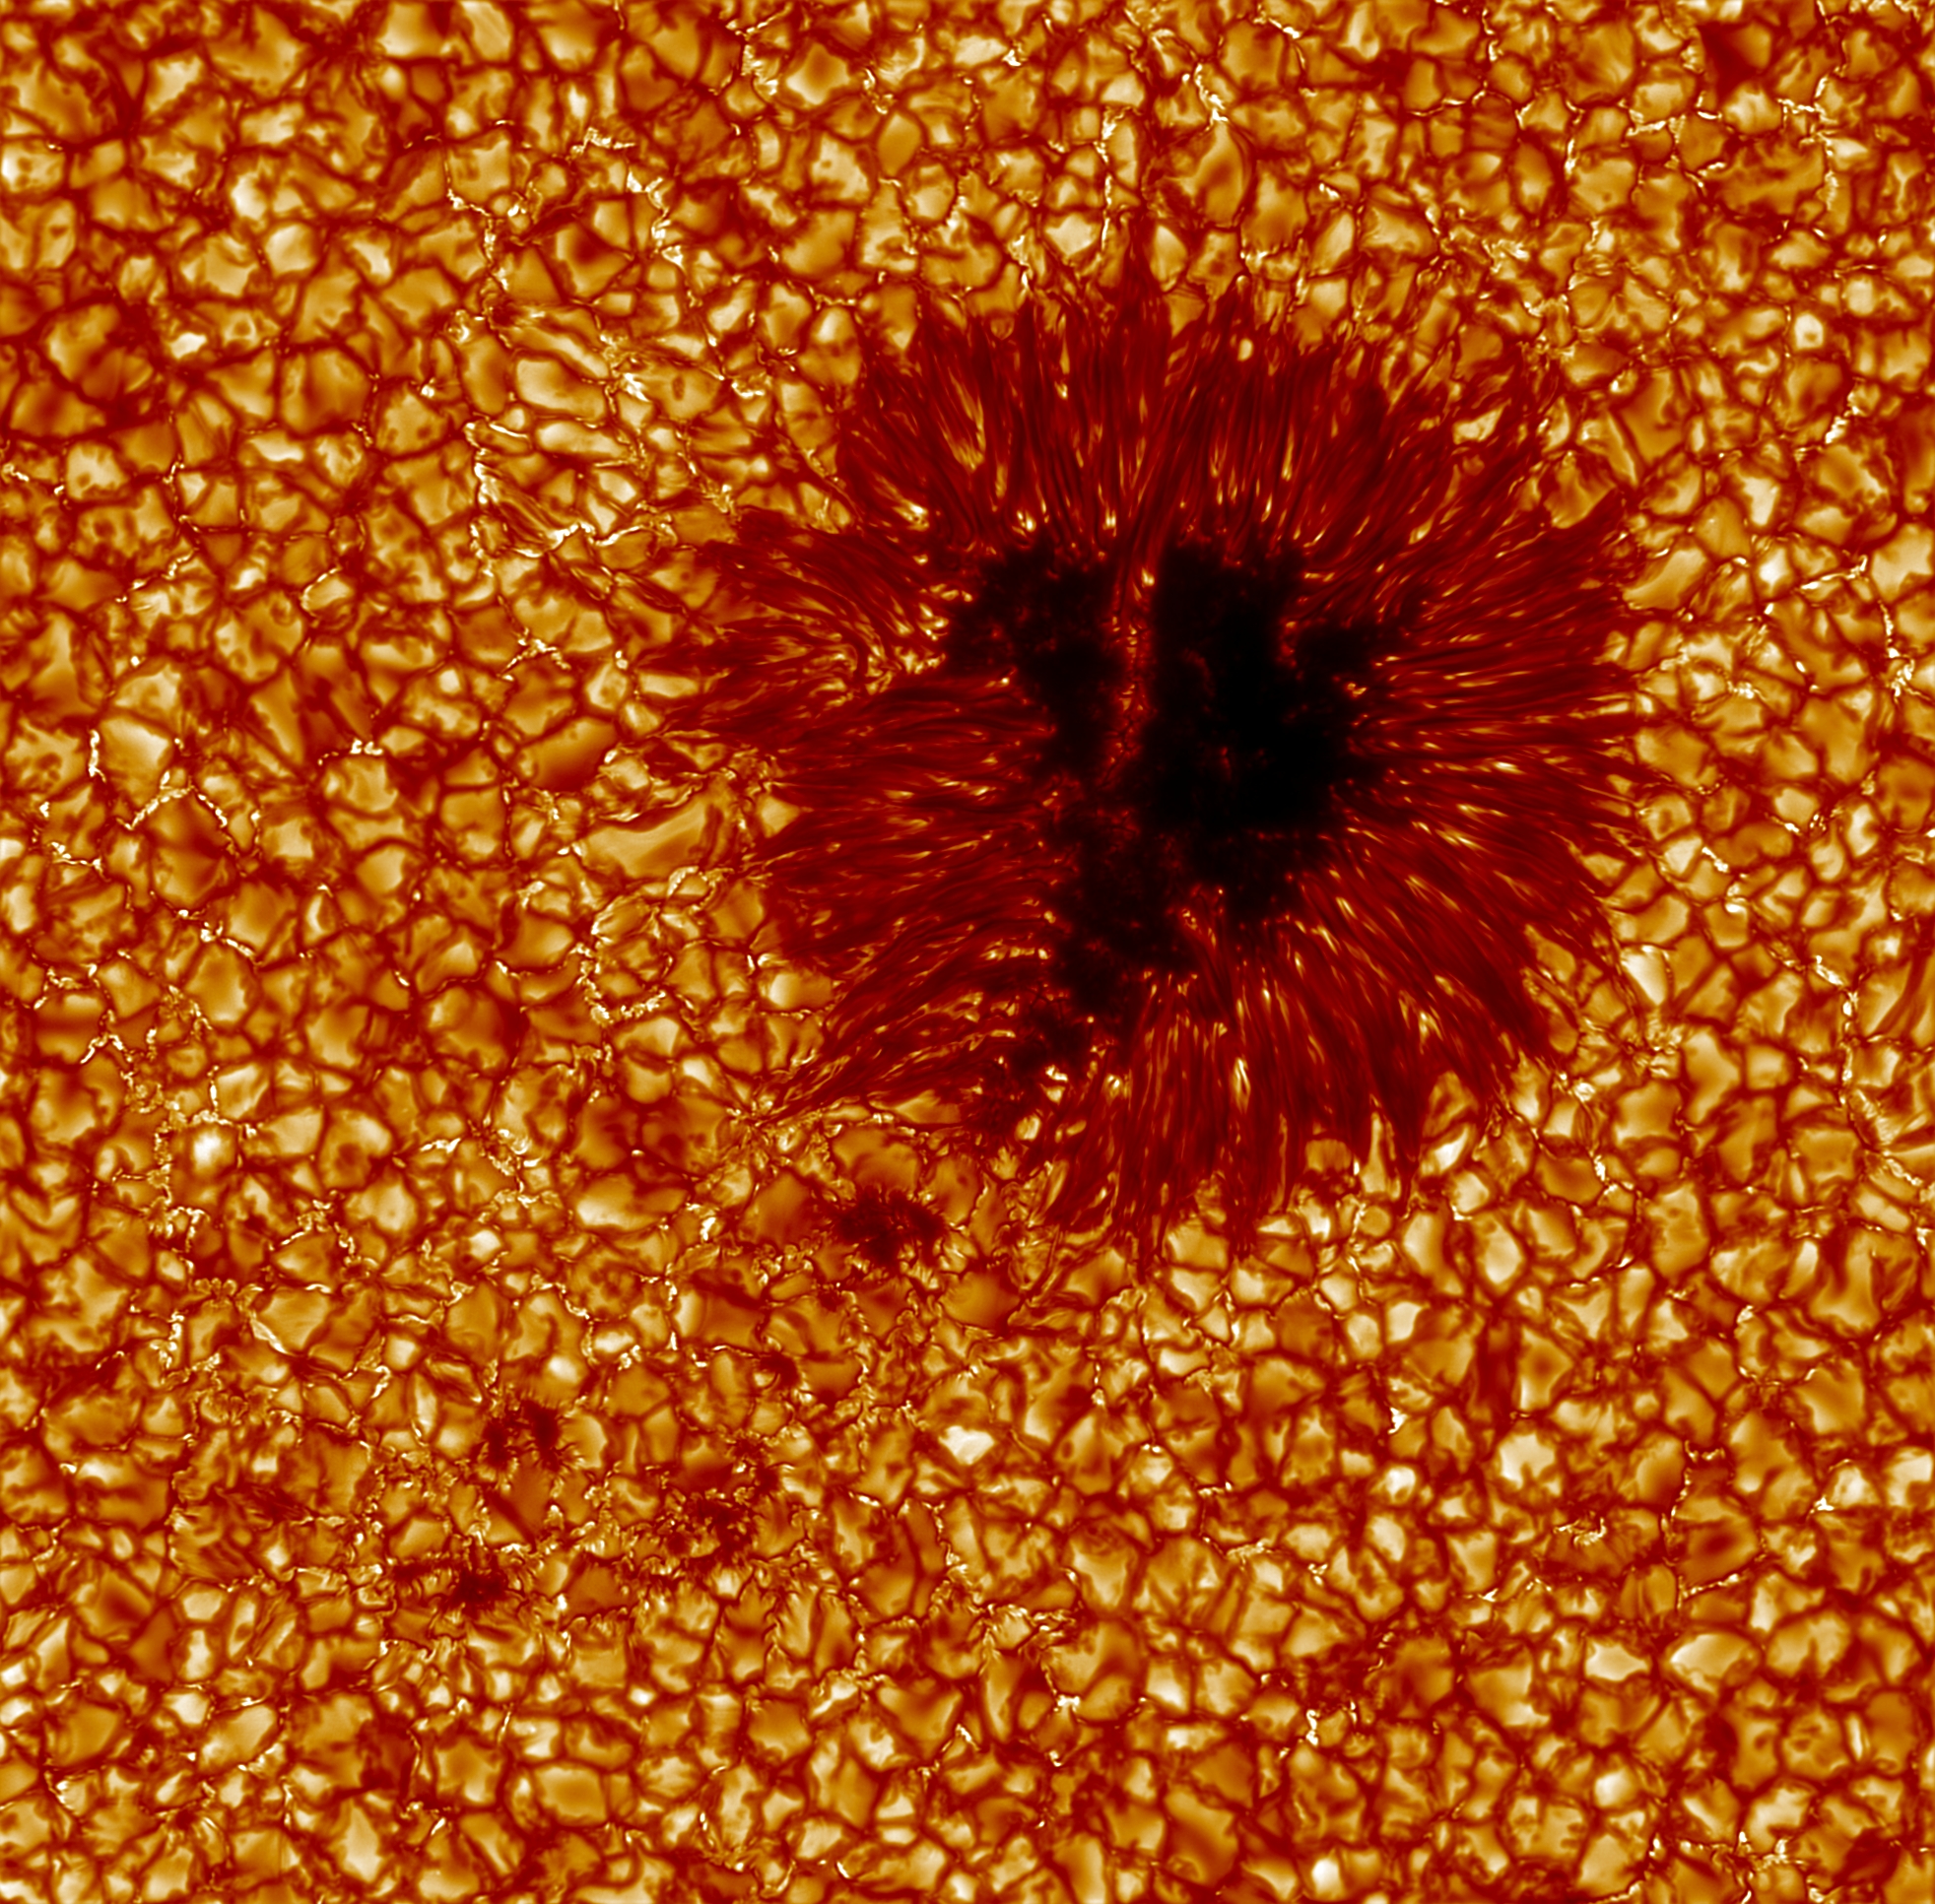
A sunspot is a dark patch on the sun. It is associated with a strong magnetic field. The central part of the sunspot is the dark umbra. It is surrounded by the penumbra, which has a filamentary structure similar to the petals of a flower.
Sunspots are darker than their surroundings because the magnetic field inhibits the convective motions under the surface that transports heat. But they are not completely dark and cold. It may sound strange, but one of many sunspot mysteries is why they are so bright! After all, the penumbra shines with about 75% of the ordinary solar output.
What physical processes shape and heat the penumbra? Is it convection of the kind that is working just below the ordinary, or "quiet" solar surface? There, the convection gives rise to the pattern called granulation where hot bright gas is rising and cold dark gas is sinking. If similar processes are important for the penumbra, there should be a systematic pattern of up-and-down motions in the gas. But such a pattern has not been seen — until now.
The downflows identified in the current study are statistically associated with darker regions and must be convective in nature. The conclusion is that the penumbra is powered, and to a large extent structured, by a convective flow from below. This result, which is supported by recent simulation results, should settle a long-standing scientific debate.
The convective downflows and upflows are associated with a strong (several km/s) horizontal outflow directed radially outwards from the sunspot centre. These horizontal flows constitute the famous and mysterious Evershed effect. The identification of the penumbral flows as being convective in origin finally explains this century-old mystery. The Evershed effect was discovered in 1909 by John Evershed at the Kodaikanal Observatory in India.
The detection of these convective downflows was not easy. It required the following:
Associated multimedia
The images may be reproduced if the source is stated as in the credit line.
Clicking on the images should lead to higher resolution versions.
The movie and some images exist in higher resolution here for printing and broadcasting.
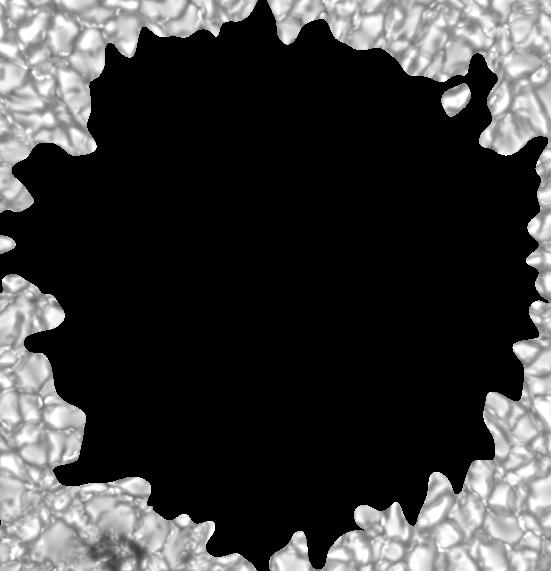
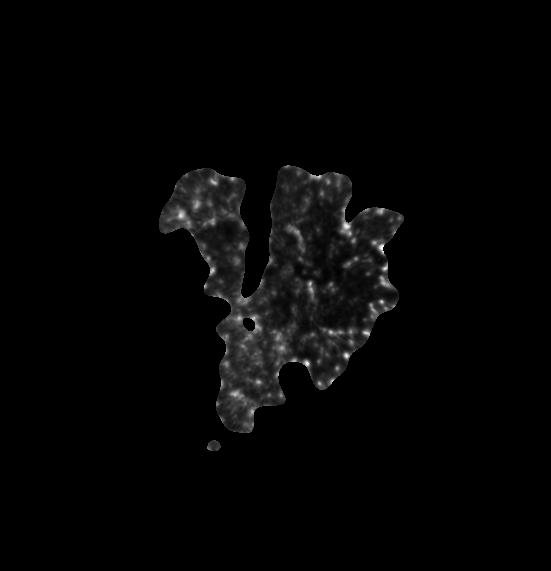
| Sunspot in context | Surrounding granulation | Umbra | Penumbra | Velocity field of the penumbra |
|---|---|---|---|---|
 |
 |
 |
 |
 |
Credit: The Royal Swedish Academy of Sciences, G.B. Scharmer, V.M.J. Henriques, D. Kiselman, J. de la Cruz Rodríguez
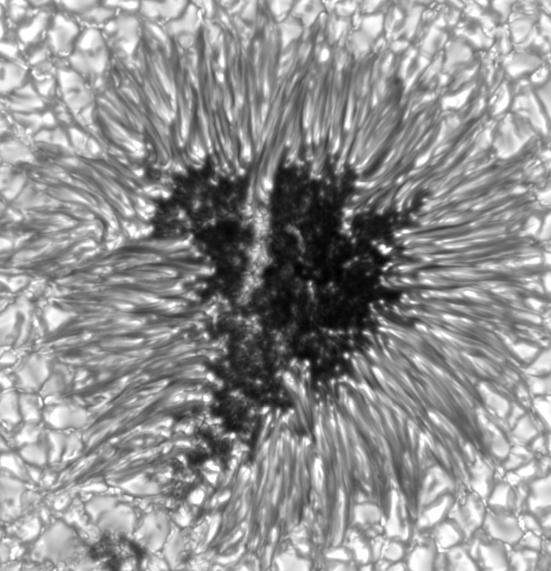
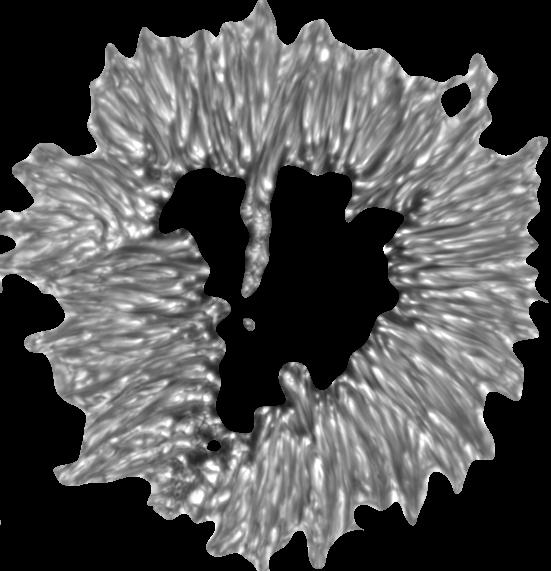
 An image of the sunspot and its surroundings taken in violet light where the spatial resolution is highest.
The image has been colourised for aesthetic reasons. The sunspot consists of the central dark umbra surrounded by the filamentary penumbra. The spot is surrounded by granulation. The field of view corresponds to 47000 km on the Sun.
This image with 0.1 arcsecond resolution from the Swedish 1-m Solar Telescope represents the limit of what is currently possible in terms of spatial resolution.
An image of the sunspot and its surroundings taken in violet light where the spatial resolution is highest.
The image has been colourised for aesthetic reasons. The sunspot consists of the central dark umbra surrounded by the filamentary penumbra. The spot is surrounded by granulation. The field of view corresponds to 47000 km on the Sun.
This image with 0.1 arcsecond resolution from the Swedish 1-m Solar Telescope represents the limit of what is currently possible in terms of spatial resolution.
Credit: The Royal Swedish Academy of Sciences, V.M.J. Henriques
 Time-lapse movie of the sunspot acquired in violet light. Colourised for aesthetic reasons.
The sequence corresponds to 53 minutes in real time.
The movements you see are not the flows that is the subject of this work. You need spectroscopy
to see up- or downflows with the help of the Doppler effect. In the movie,
there seems to be an inward motion in the penumbral filaments, but the real gas flow is mainly
directed outwards. The motions are mainly a movement of patterns. (For the moment via YouTube.)
Time-lapse movie of the sunspot acquired in violet light. Colourised for aesthetic reasons.
The sequence corresponds to 53 minutes in real time.
The movements you see are not the flows that is the subject of this work. You need spectroscopy
to see up- or downflows with the help of the Doppler effect. In the movie,
there seems to be an inward motion in the penumbral filaments, but the real gas flow is mainly
directed outwards. The motions are mainly a movement of patterns. (For the moment via YouTube.)
Credit: The Royal Swedish Academy of Sciences, V.M.J. Henriques
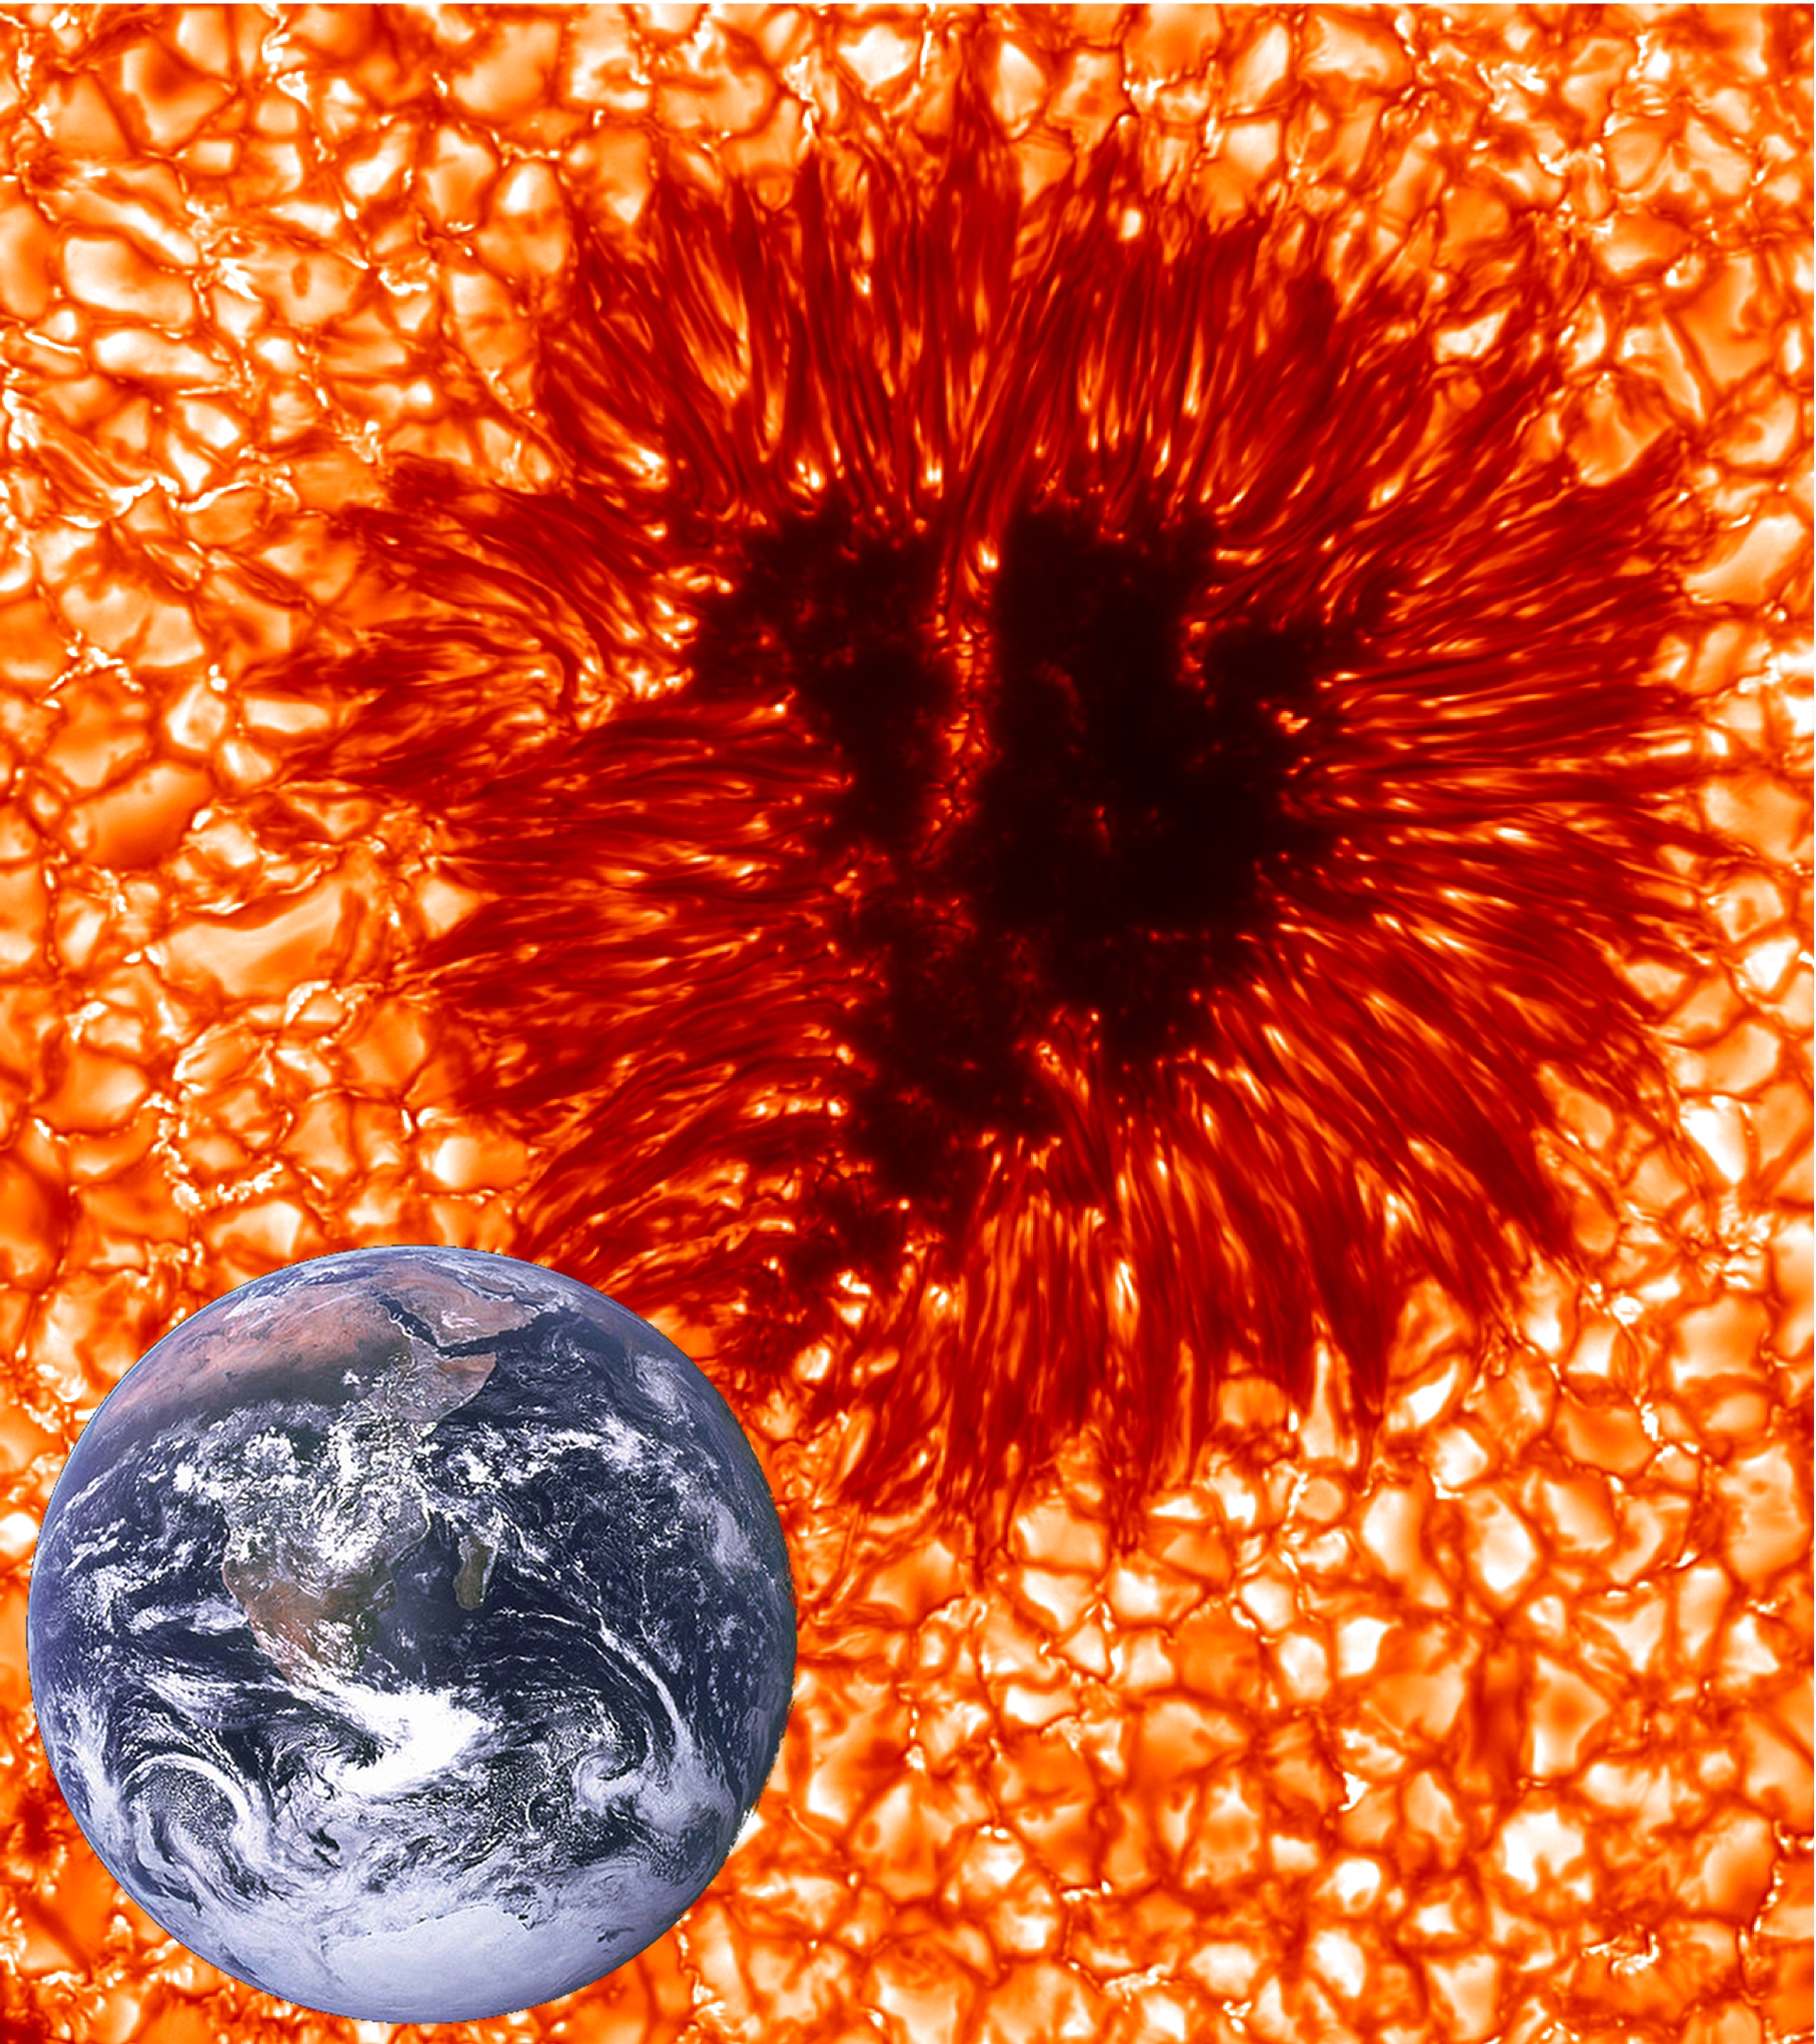 An image of the sunspot with the Earth shown to scale. The solar image is acquired in violet light and colourised for aesthetic reasons.
Credit: The Royal Swedish Academy of Sciences, V.M.J. Henriques, Dan Kiselman, and NASA (Earth image)
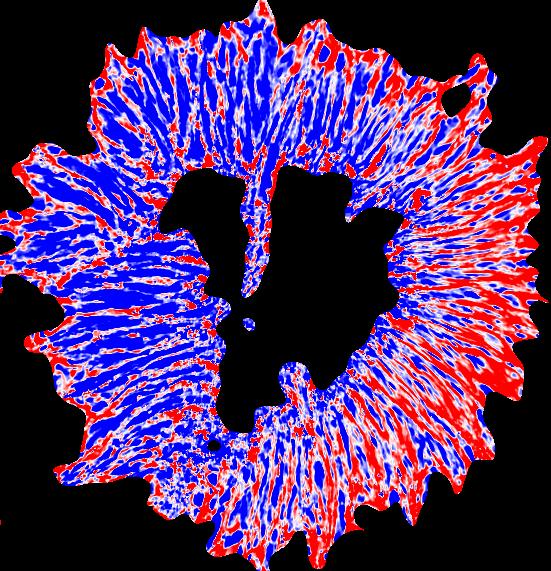
 Colourised map showing velocities in the sunspot and surroundings as measured using the Doppler effect.
Blue implies that the gas is moving towards us — this corresponds to a mostly upward motion on the solar surface.
Red implies that the gas is moving away from us — this corresponds to a mostly downward motion on the solar surface.
The net-like pattern surrounding the sunspot is solar granulation.
The field of view corresponds to 24000 km on the Sun.
Colourised map showing velocities in the sunspot and surroundings as measured using the Doppler effect.
Blue implies that the gas is moving towards us — this corresponds to a mostly upward motion on the solar surface.
Red implies that the gas is moving away from us — this corresponds to a mostly downward motion on the solar surface.
The net-like pattern surrounding the sunspot is solar granulation.
The field of view corresponds to 24000 km on the Sun.
Credit: The Royal Swedish Academy of Sciences, G.B. Scharmer, V.M.J. Henriques, D. Kiselman, J. de la Cruz Rodríguez
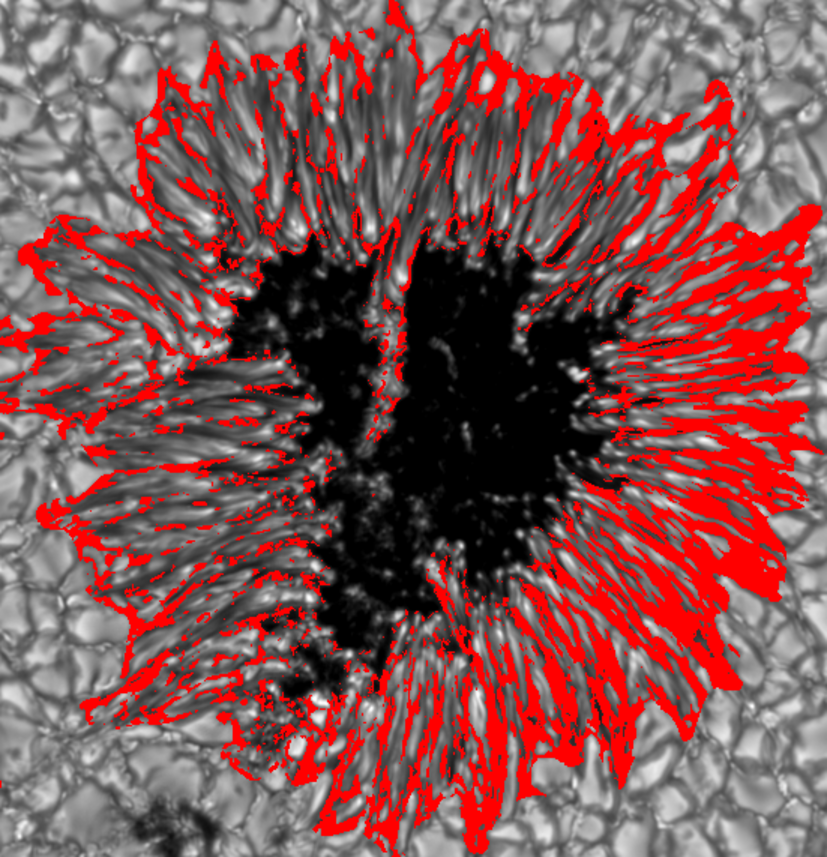
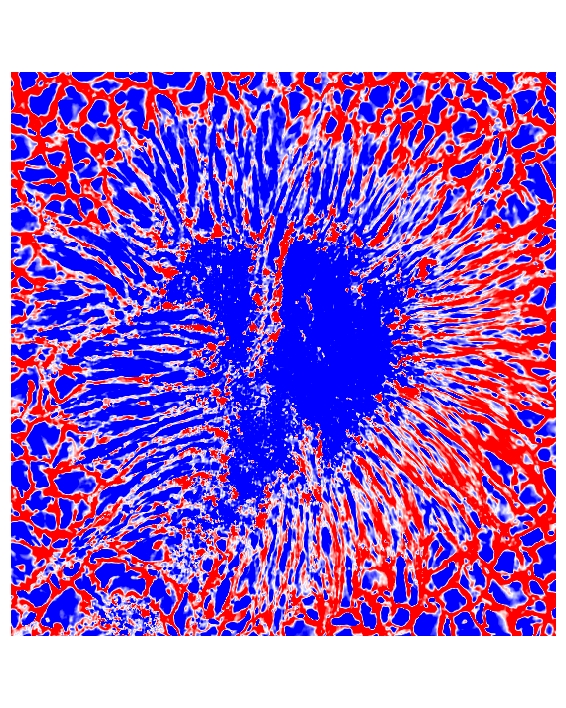
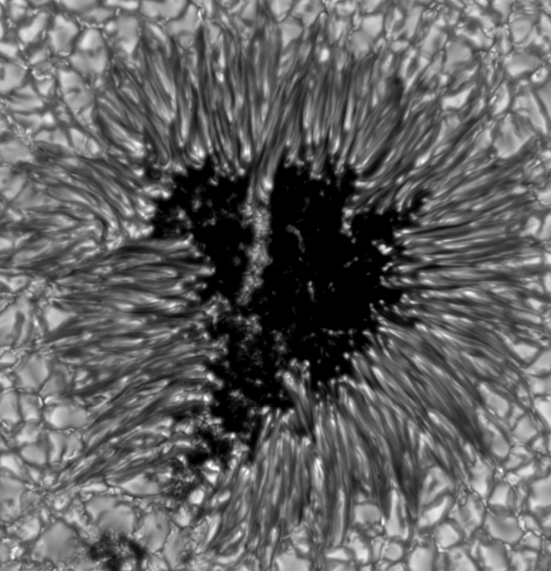 Image of the sunspot with an overlay of the penumbral velocity field that alternately shows redshifts and blueshifts.
Blue implies that the gas is moving towards us — this corresponds to a mostly upward motion on the solar surface.
Red implies that the gas is moving away from us — this corresponds to a mostly downward motion on the solar surface.
Image of the sunspot with an overlay of the penumbral velocity field that alternately shows redshifts and blueshifts.
Blue implies that the gas is moving towards us — this corresponds to a mostly upward motion on the solar surface.
Red implies that the gas is moving away from us — this corresponds to a mostly downward motion on the solar surface.
The asymmetry in the red/blue images is due to the fact that the sunspot is seen at an angle. The outward-directed Evershed flow thus displays a redshift on the side of the sunspot that is pointing away from the observer and a blue shift on the other side: the solar-centre side which is to the left in the image. That redshifts are still seen on the solar-centre side is a graphic way of illustrating the result of this work, whose main conclusions rest on a statistical analysis.
Credit: The Royal Swedish Academy of Sciences, G.B. Scharmer, V.M.J. Henriques, D. Kiselman, J. de la Cruz Rodríguez
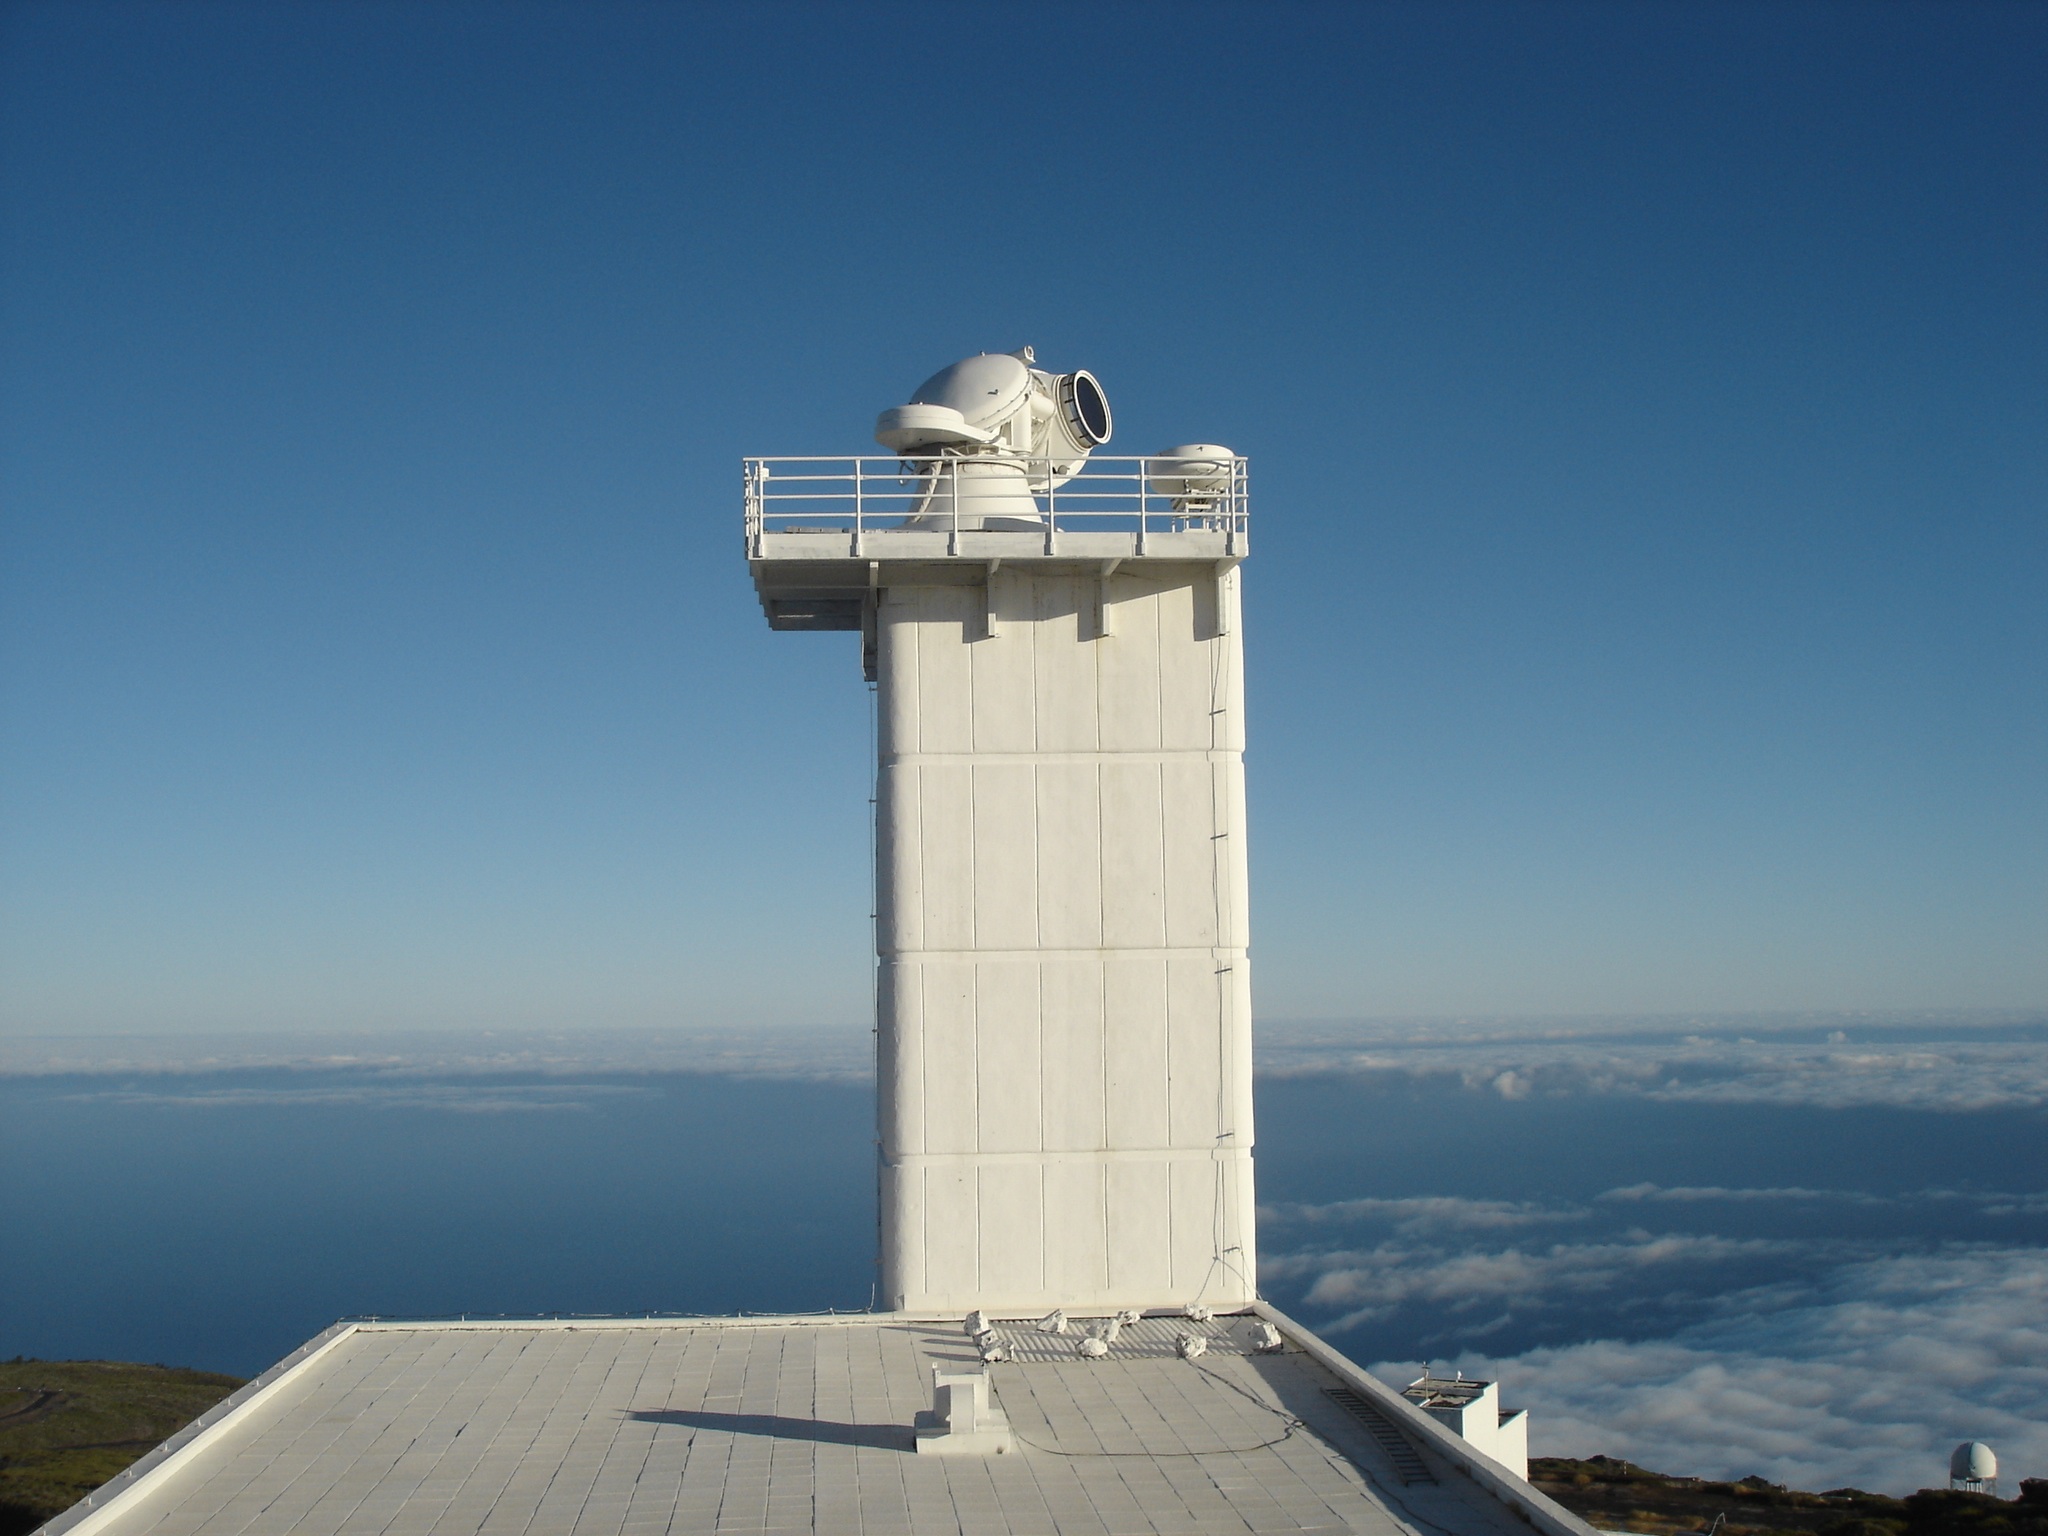 The Swedish 1-m Solar Telescope (SST) on La Palma. The telescope is pointed towards the rising Sun.
Credit: D. Kiselman