
 Higher-resolution versions for printing and broadcasting
The images may be reproduced if the source is stated as in the credit line.
Clicking on the images should lead to higher resolution versions.
| Sunspot in context | Surrounding granulation | Umbra | Penumbra | Velocity field of the penumbra |
|---|---|---|---|---|
 |
 |
 |
 |
 |
Credit: The Royal Swedish Academy of Sciences, G.B. Scharmer, V.M.J. Henriques, D. Kiselman, J. de la Cruz Rodríguez
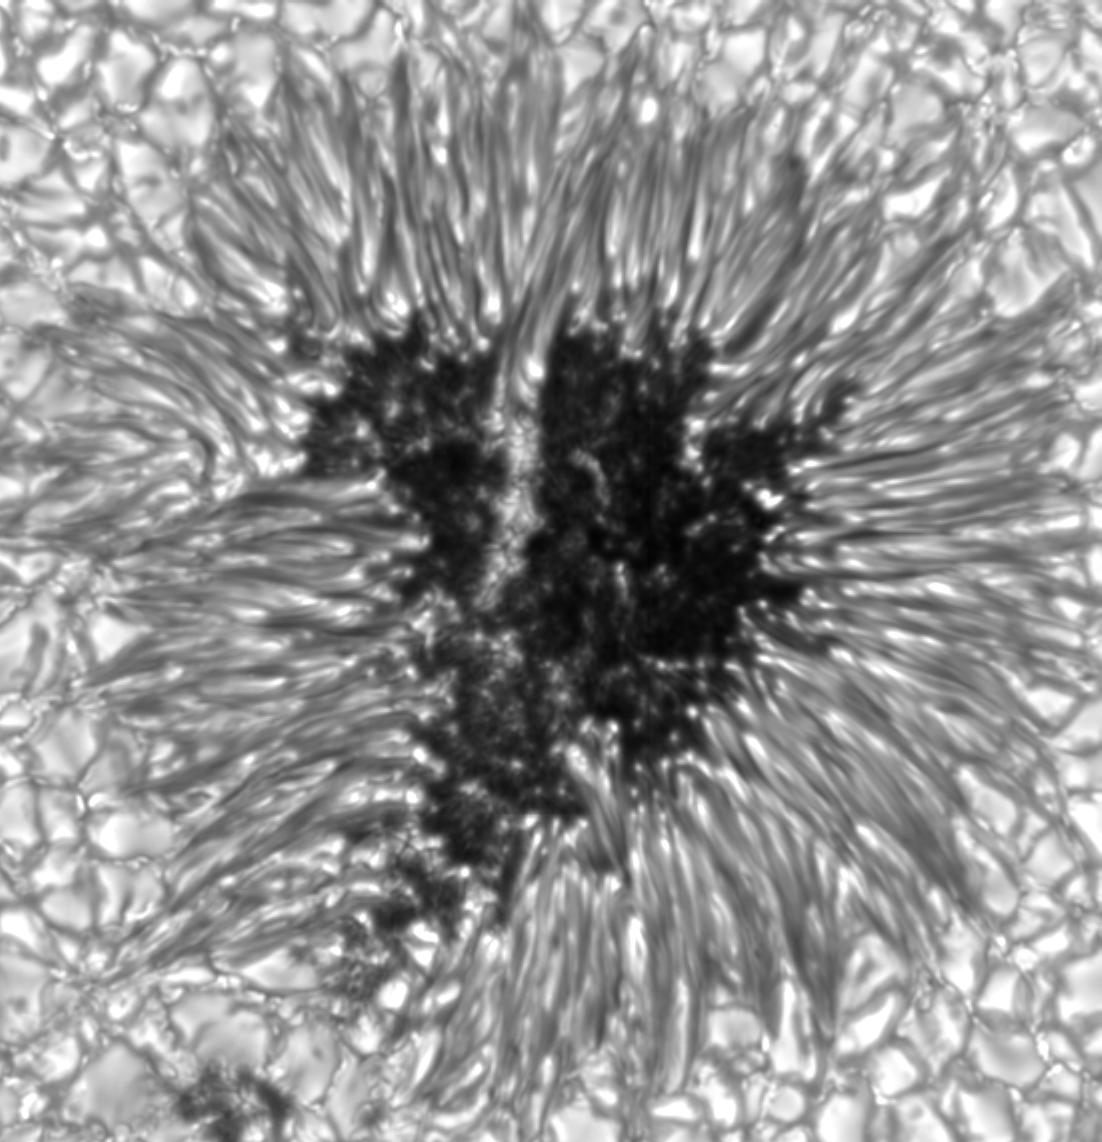
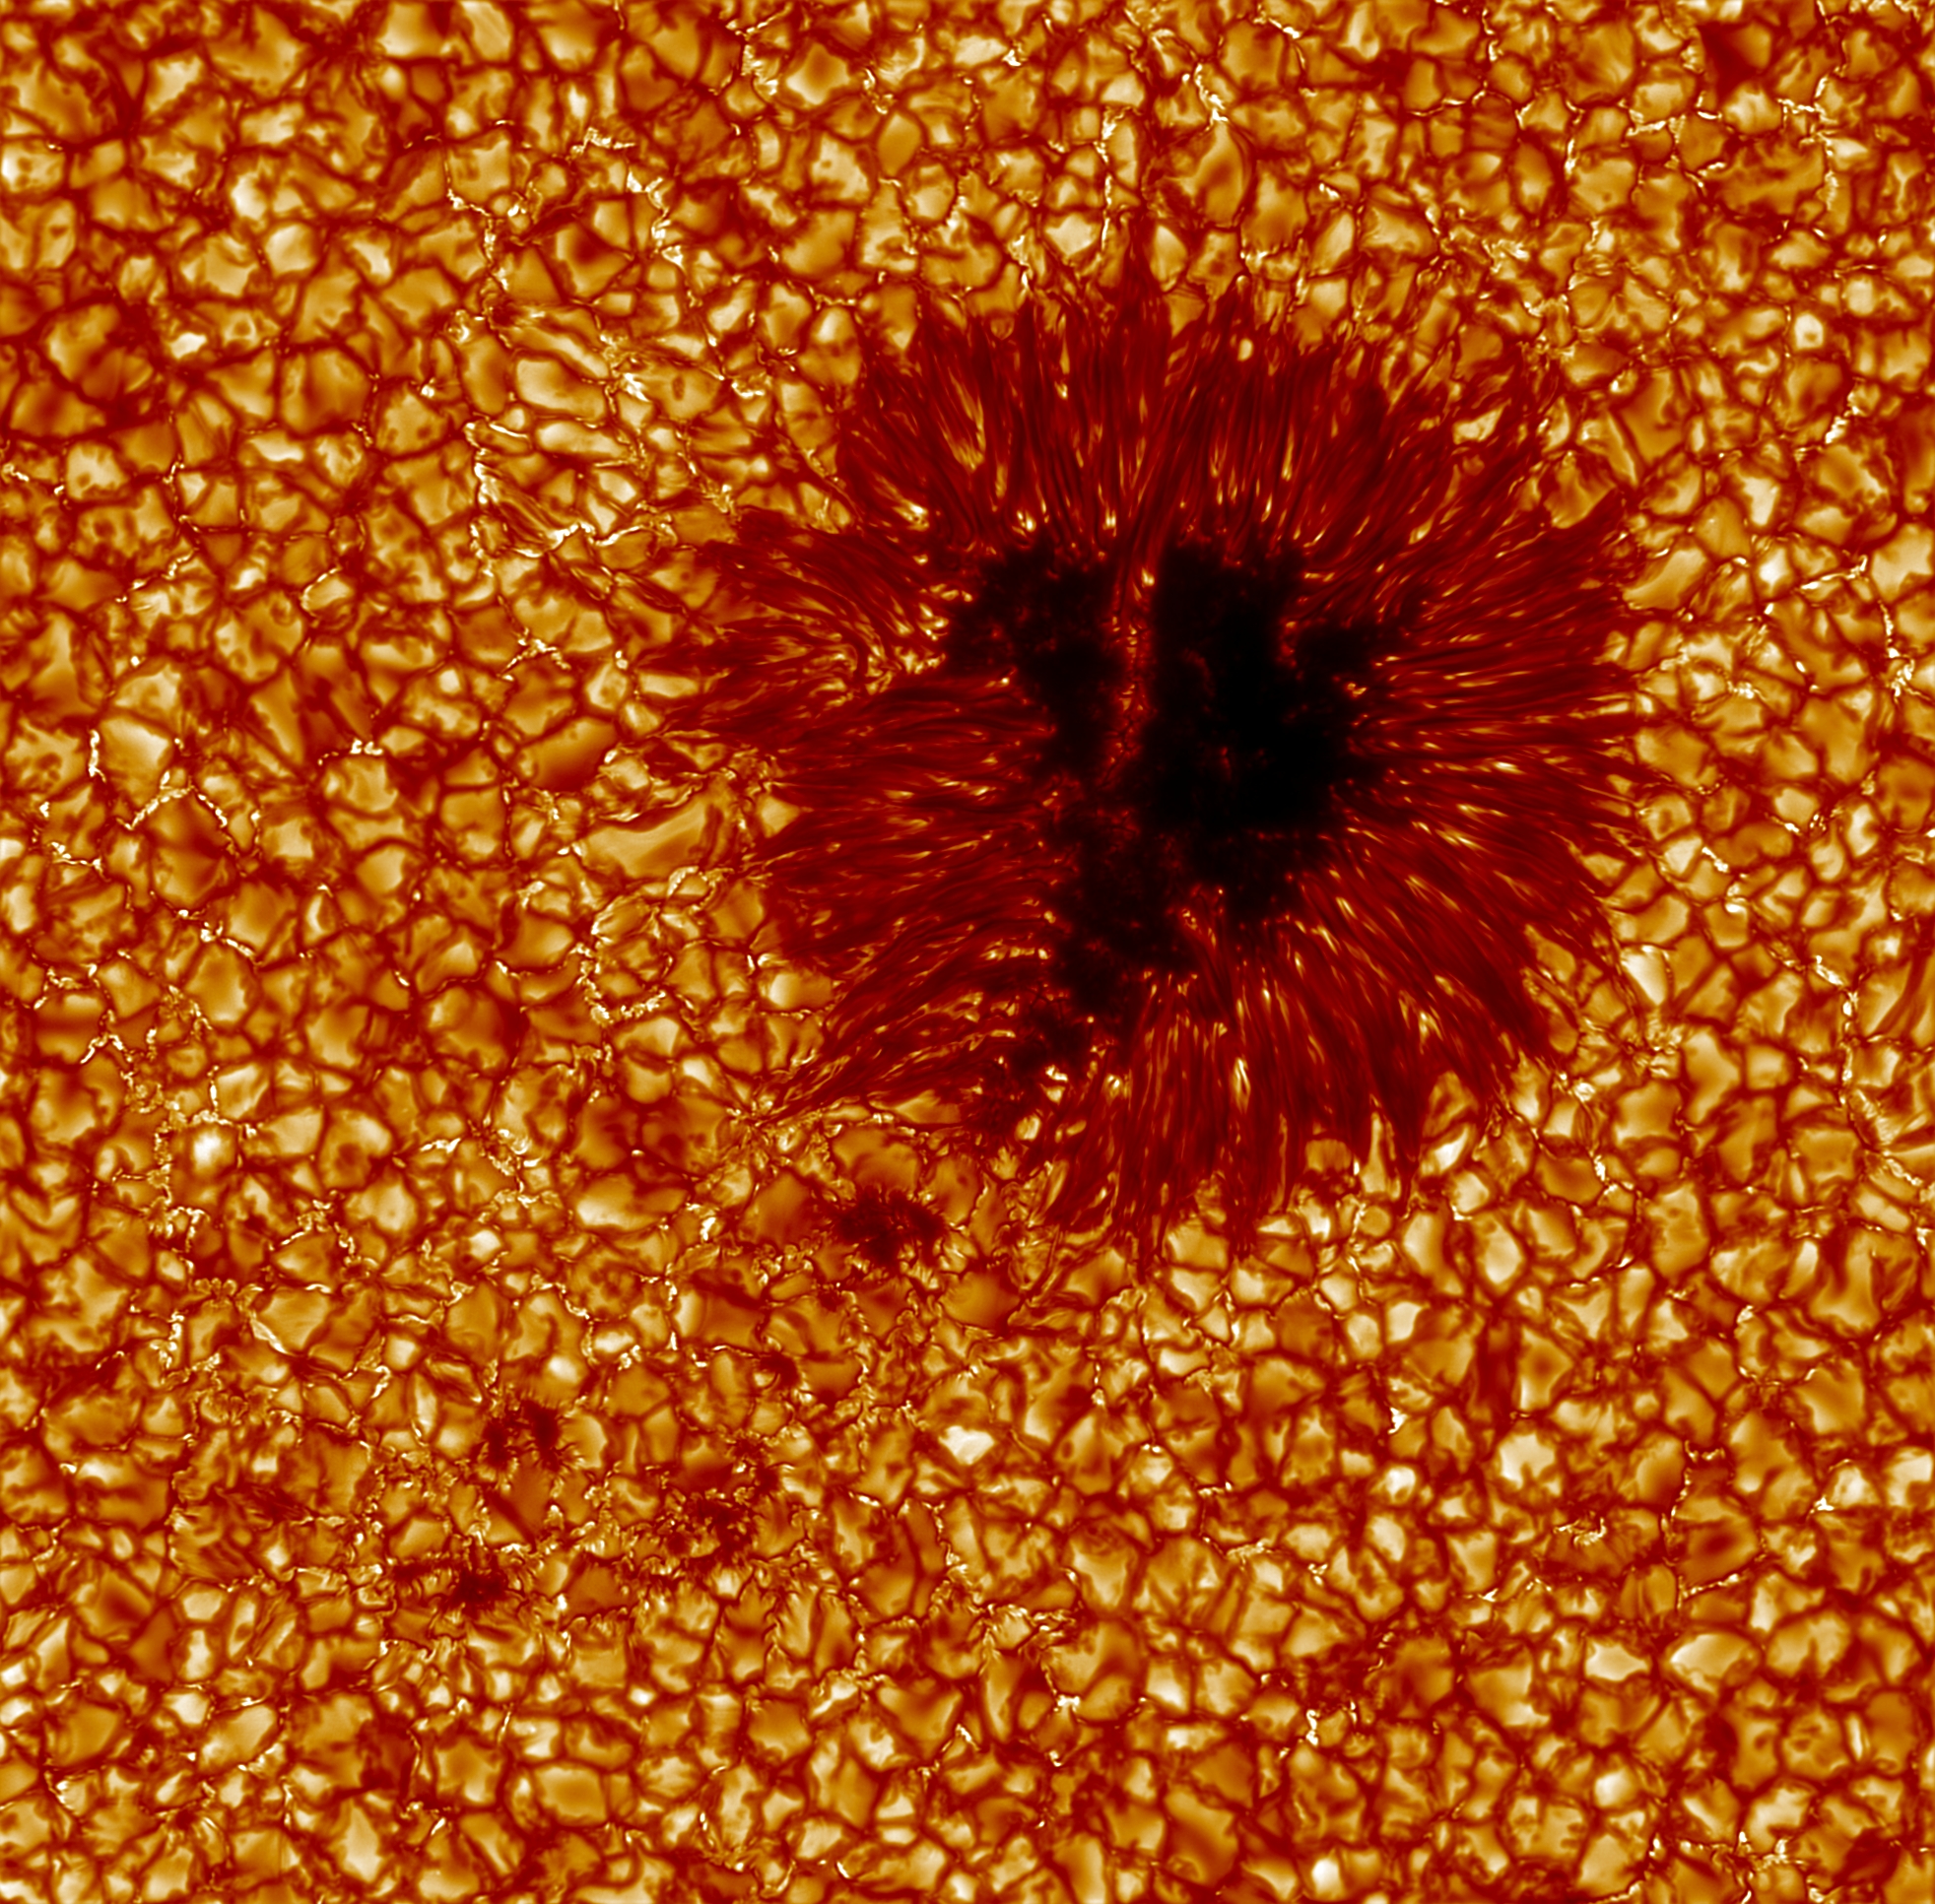 An image of the sunspot and its surroundings taken in violet light where the spatial resolution is highest.
The image has been colourised for aesthetic reasons. The sunspot consists of the central dark umbra surrounded by the filamentary penumbra. The spot is surrounded by granulation. The field of view corresponds to 47000 km on the Sun.
This image with 0.1 arcsecond resolution from the Swedish 1-m Solar Telescope represents the limit of what is currently possible in terms of spatial resolution.
An image of the sunspot and its surroundings taken in violet light where the spatial resolution is highest.
The image has been colourised for aesthetic reasons. The sunspot consists of the central dark umbra surrounded by the filamentary penumbra. The spot is surrounded by granulation. The field of view corresponds to 47000 km on the Sun.
This image with 0.1 arcsecond resolution from the Swedish 1-m Solar Telescope represents the limit of what is currently possible in terms of spatial resolution.
Credit: The Royal Swedish Academy of Sciences, V.M.J. Henriques
 Time-lapse movie of the sunspot acquired in violet light. Colourised for aesthetic reasons.
The sequence corresponds to 53 minutes in real time.
The motions one sees are not the motions
The penumbral filaments seem to move inwards, but the gas flow is actually mainly directed outwards, away from the dark umbra. File size 38 MB.
Time-lapse movie of the sunspot acquired in violet light. Colourised for aesthetic reasons.
The sequence corresponds to 53 minutes in real time.
The motions one sees are not the motions
The penumbral filaments seem to move inwards, but the gas flow is actually mainly directed outwards, away from the dark umbra. File size 38 MB.
Credit: The Royal Swedish Academy of Sciences, V.M.J. Henriques
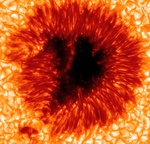
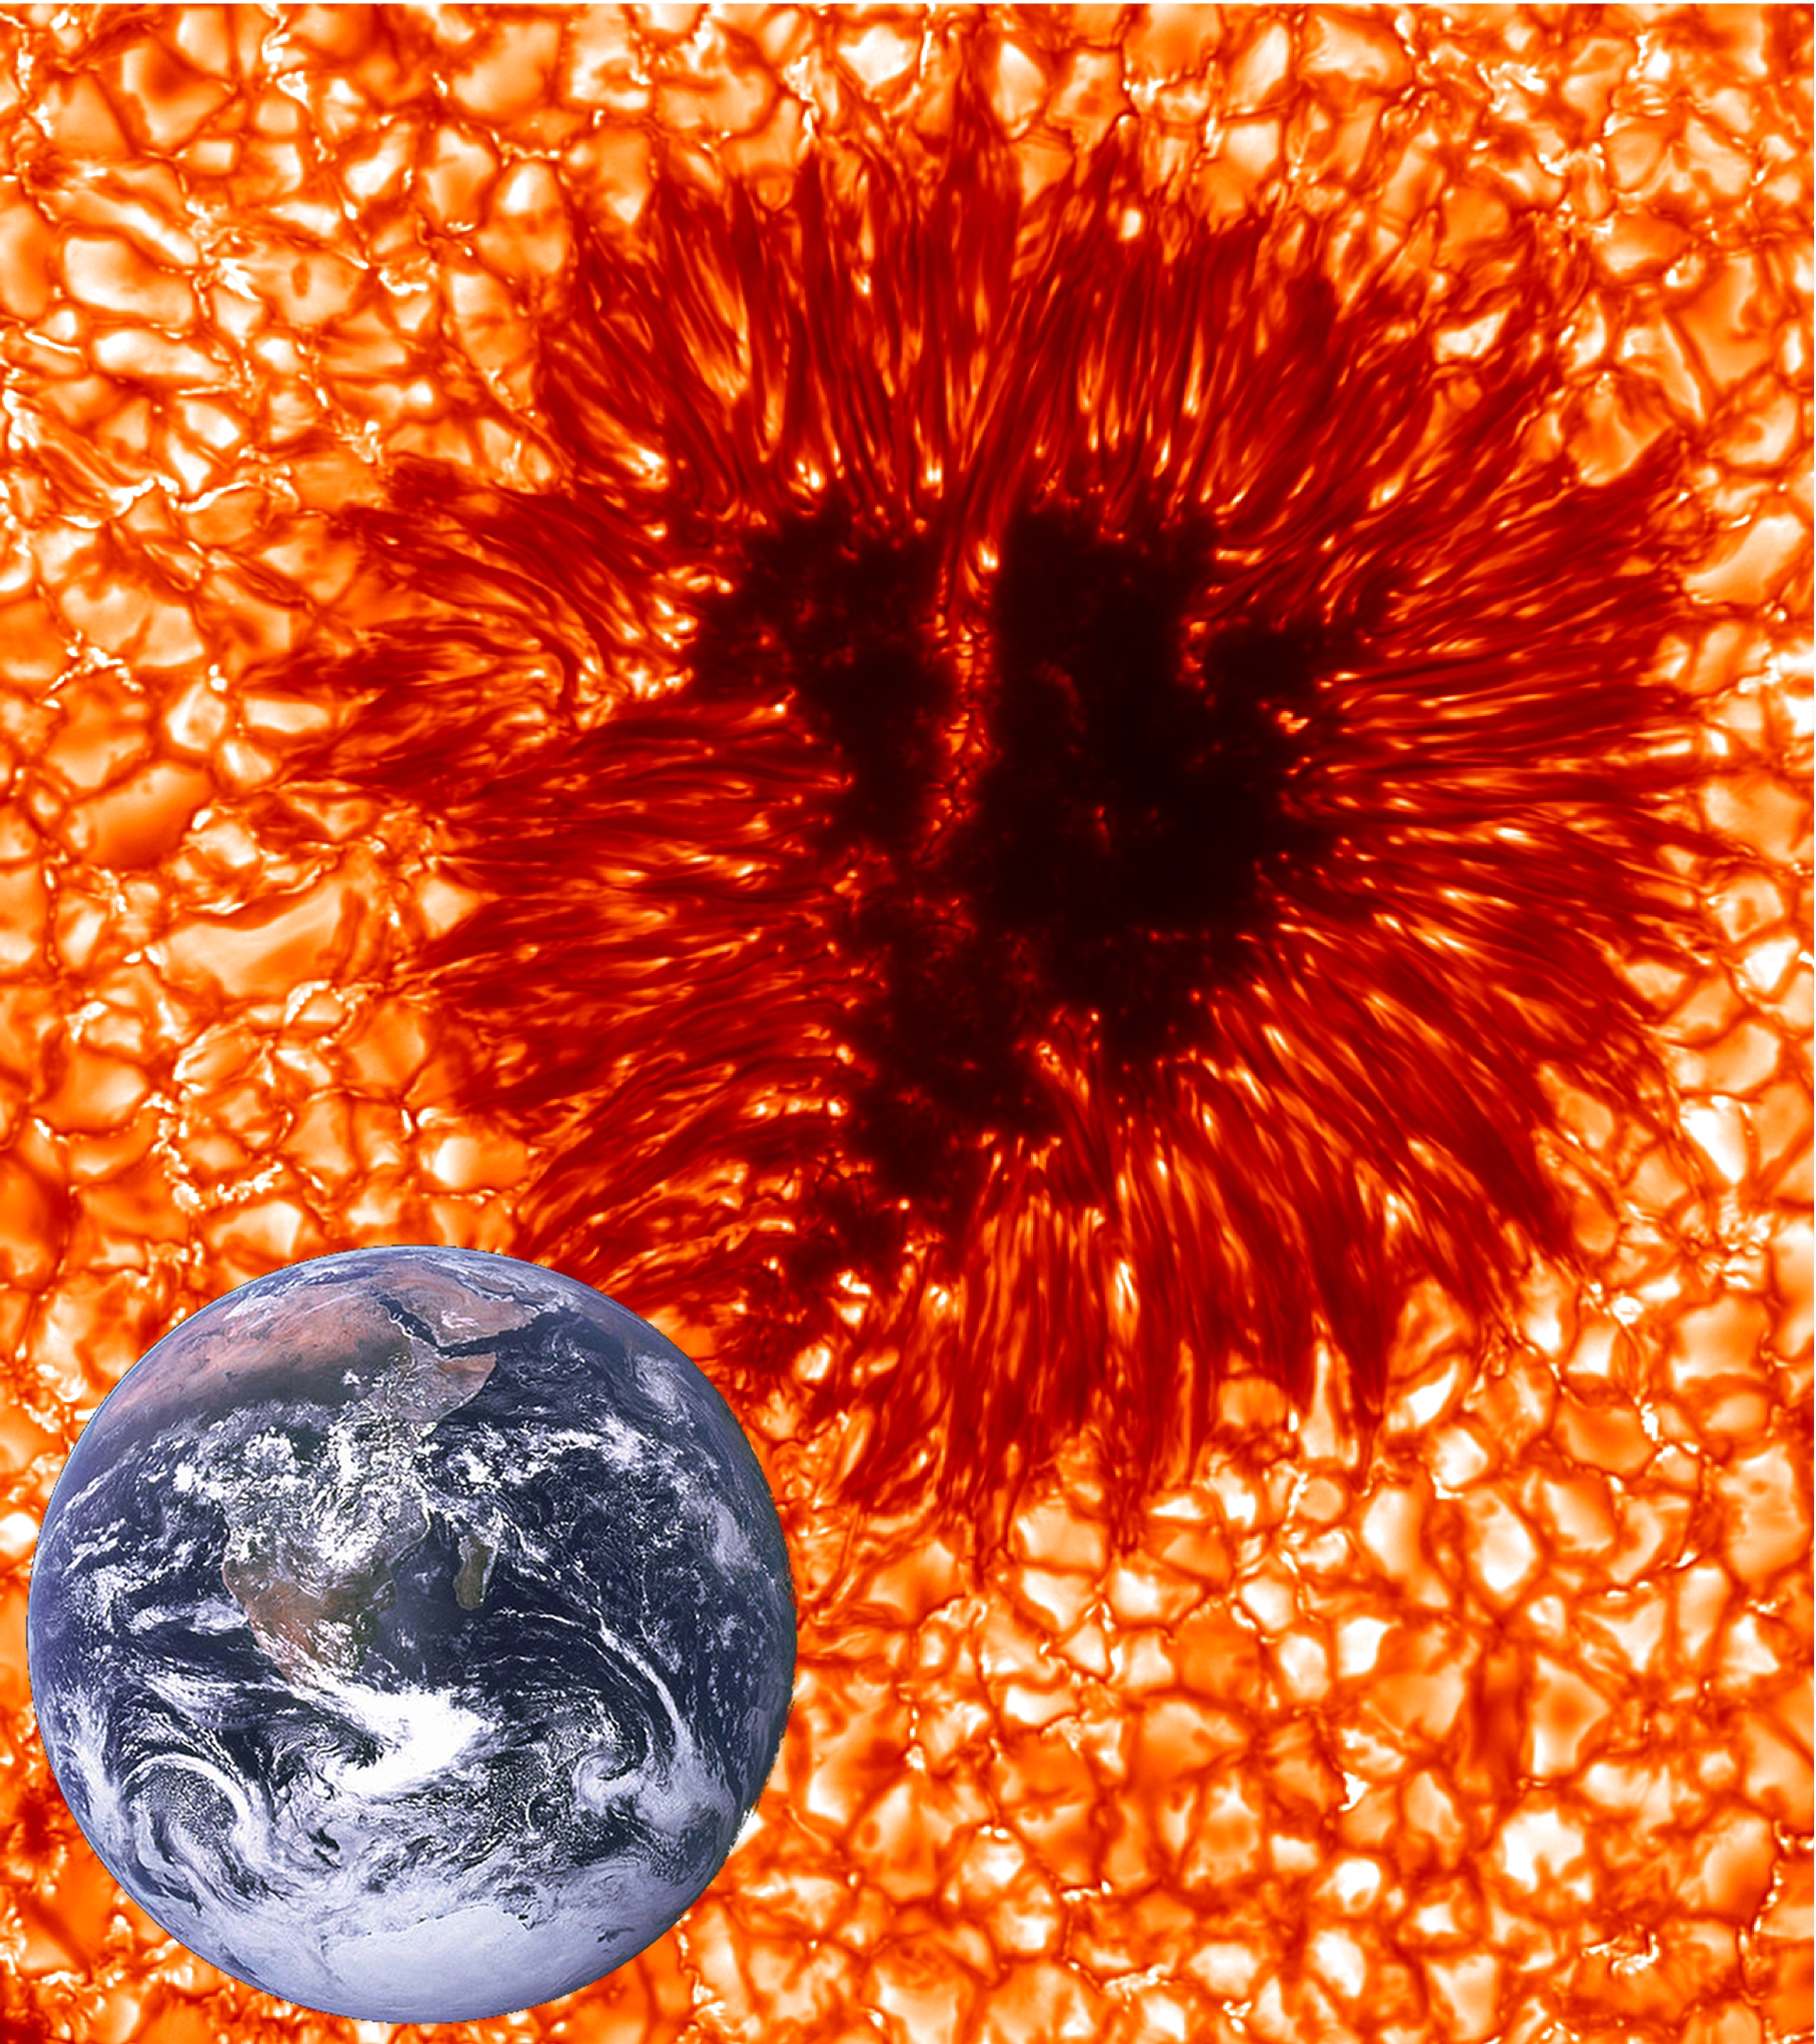 An image of the sunspot with the Earth shown to scale. The solar image is acquired in violet light and colourised for aesthetic reasons.
Credit: The Royal Swedish Academy of Sciences, V.M.J. Henriques, Dan Kiselman, and NASA (Earth image)
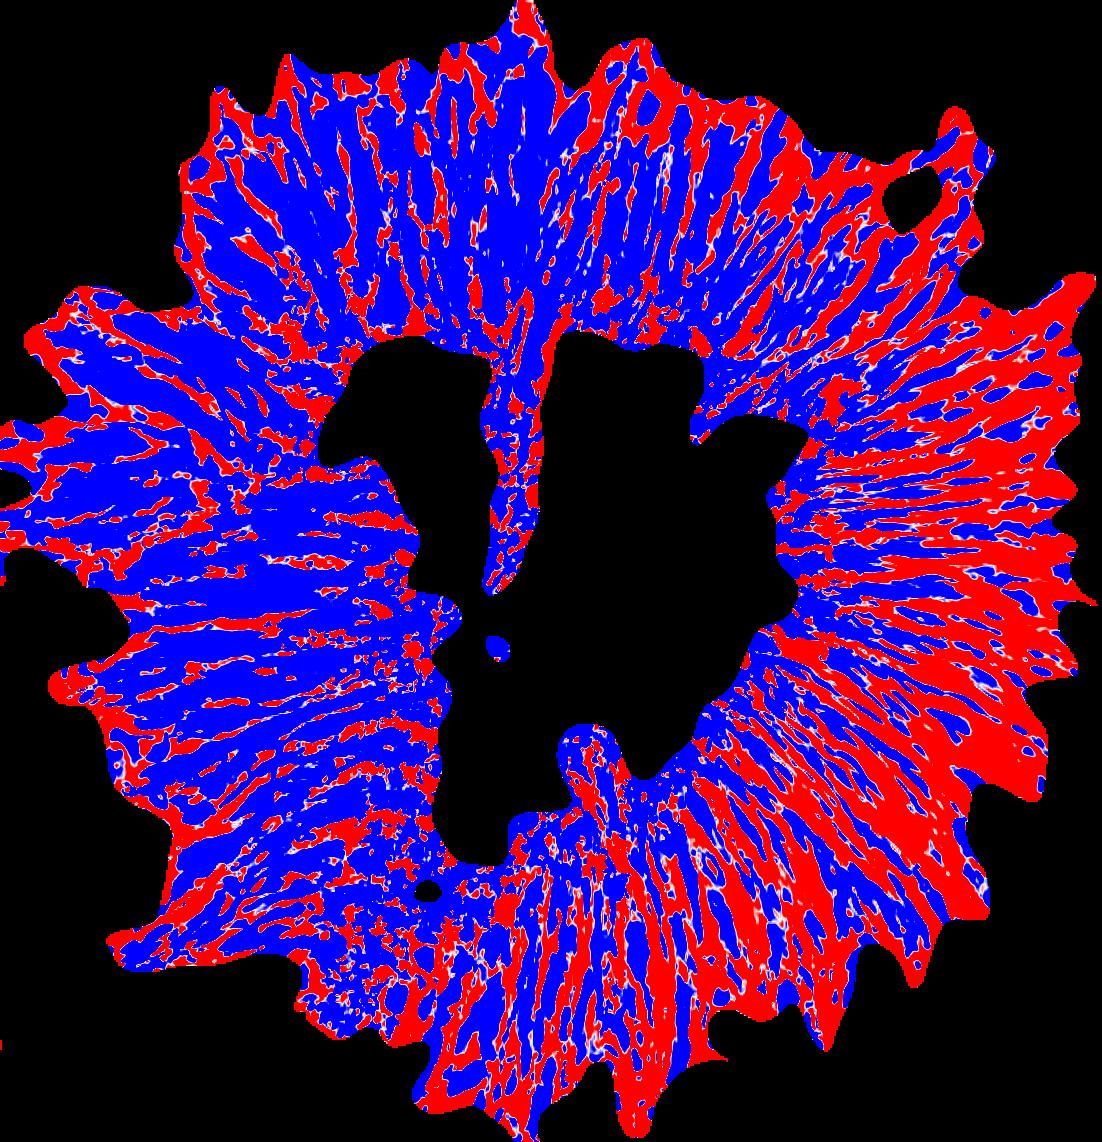
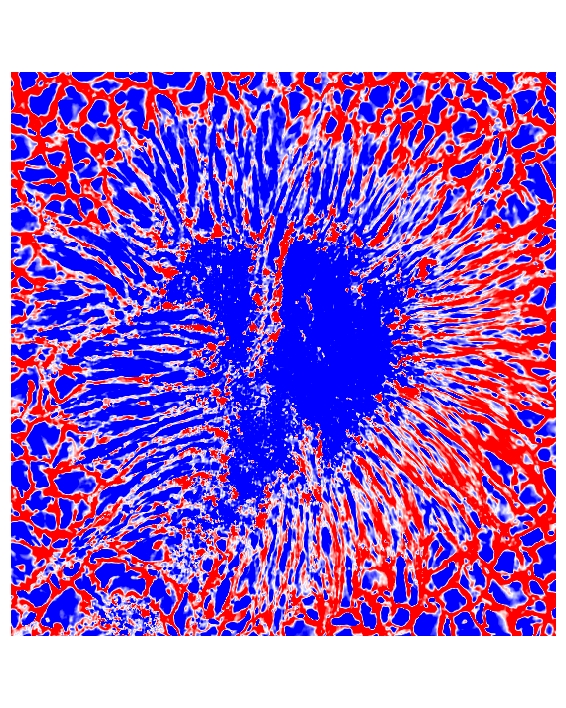 Colourised map showing velocities in the sunspot and surroundings as measured using the Doppler effect.
Blue implies that the gas is moving towards us — this corresponds to a mostly upward motion on the solar surface.
Red implies that the gas is moving away from us — this corresponds to a mostly downward motion on the solar surface.
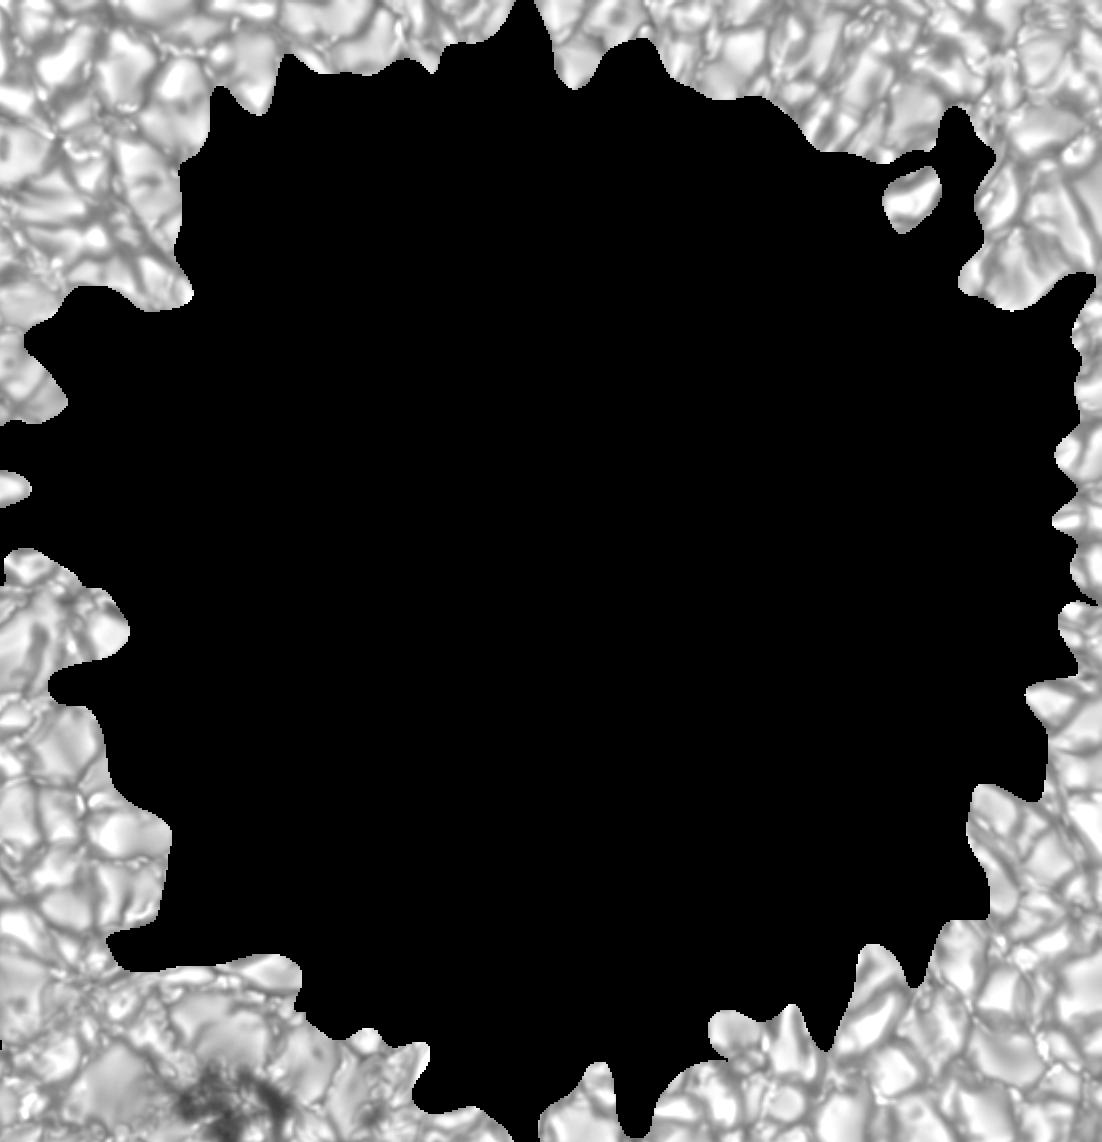
The net-like pattern surrounding the sunspot is solar granulation.
The field of view corresponds to 24000 km on the Sun.
Colourised map showing velocities in the sunspot and surroundings as measured using the Doppler effect.
Blue implies that the gas is moving towards us — this corresponds to a mostly upward motion on the solar surface.
Red implies that the gas is moving away from us — this corresponds to a mostly downward motion on the solar surface.
The net-like pattern surrounding the sunspot is solar granulation.
The field of view corresponds to 24000 km on the Sun.
Credit: The Royal Swedish Academy of Sciences, G.B. Scharmer, V.M.J. Henriques, D. Kiselman, J. de la Cruz Rodríguez
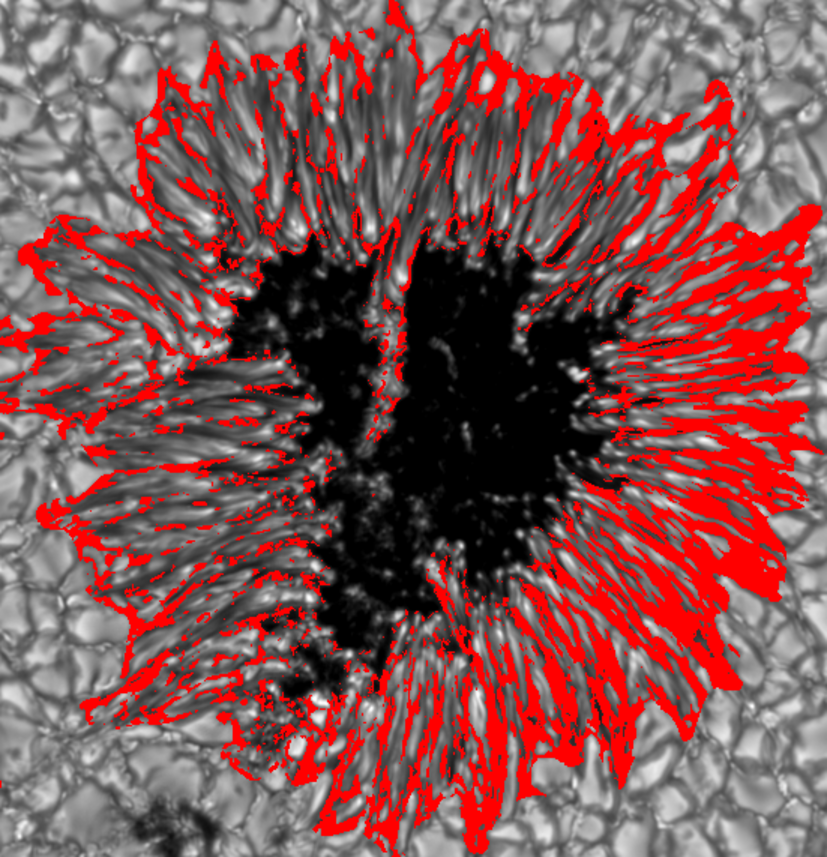
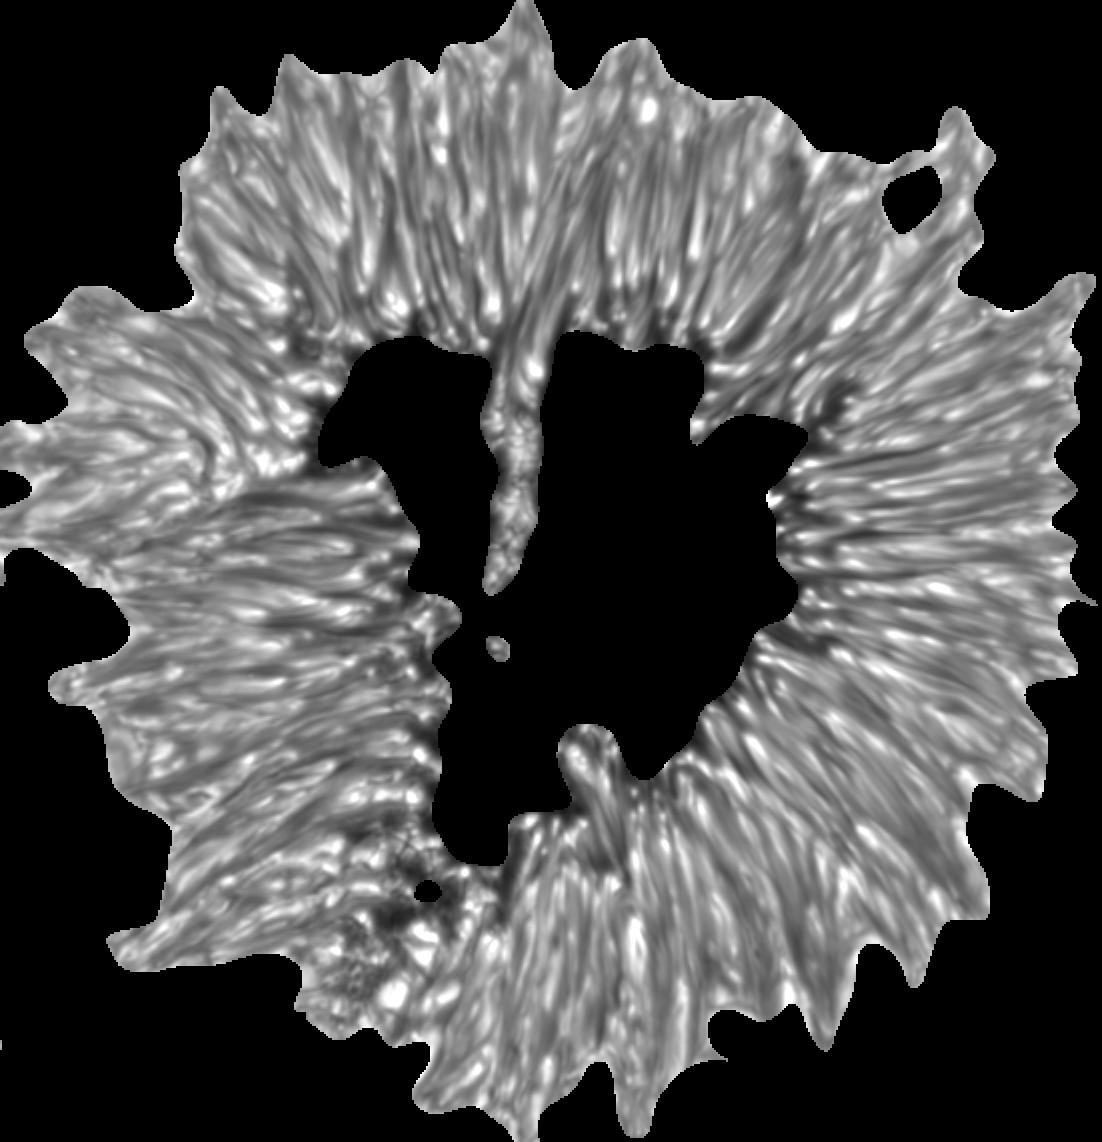
 Image of the sunspot with an overlay of the penumbral velocity field that alternately shows redshifts and blueshifts.
Blue implies that the gas is moving towards us — this corresponds to a mostly upward motion on the solar surface.
Red implies that the gas is moving away from us — this corresponds to a mostly downward motion on the solar surface.
Image of the sunspot with an overlay of the penumbral velocity field that alternately shows redshifts and blueshifts.
Blue implies that the gas is moving towards us — this corresponds to a mostly upward motion on the solar surface.
Red implies that the gas is moving away from us — this corresponds to a mostly downward motion on the solar surface.
The asymmetry in the red/blue images is due to the fact that the sunspot is seen at an angle. The outward-directed Evershed flow thus displays a redshift on the side of the sunspot that is pointing away from the observer and a blue shift on the other side: the solar-centre side which is to the left in the image. That redshifts are still seen on the solar-centre side is a graphic way of illustrating the result of this work, whose main conclusions rest on a statistical analysis.
Credit: The Royal Swedish Academy of Sciences, G.B. Scharmer, V.M.J. Henriques, D. Kiselman, J. de la Cruz Rodríguez
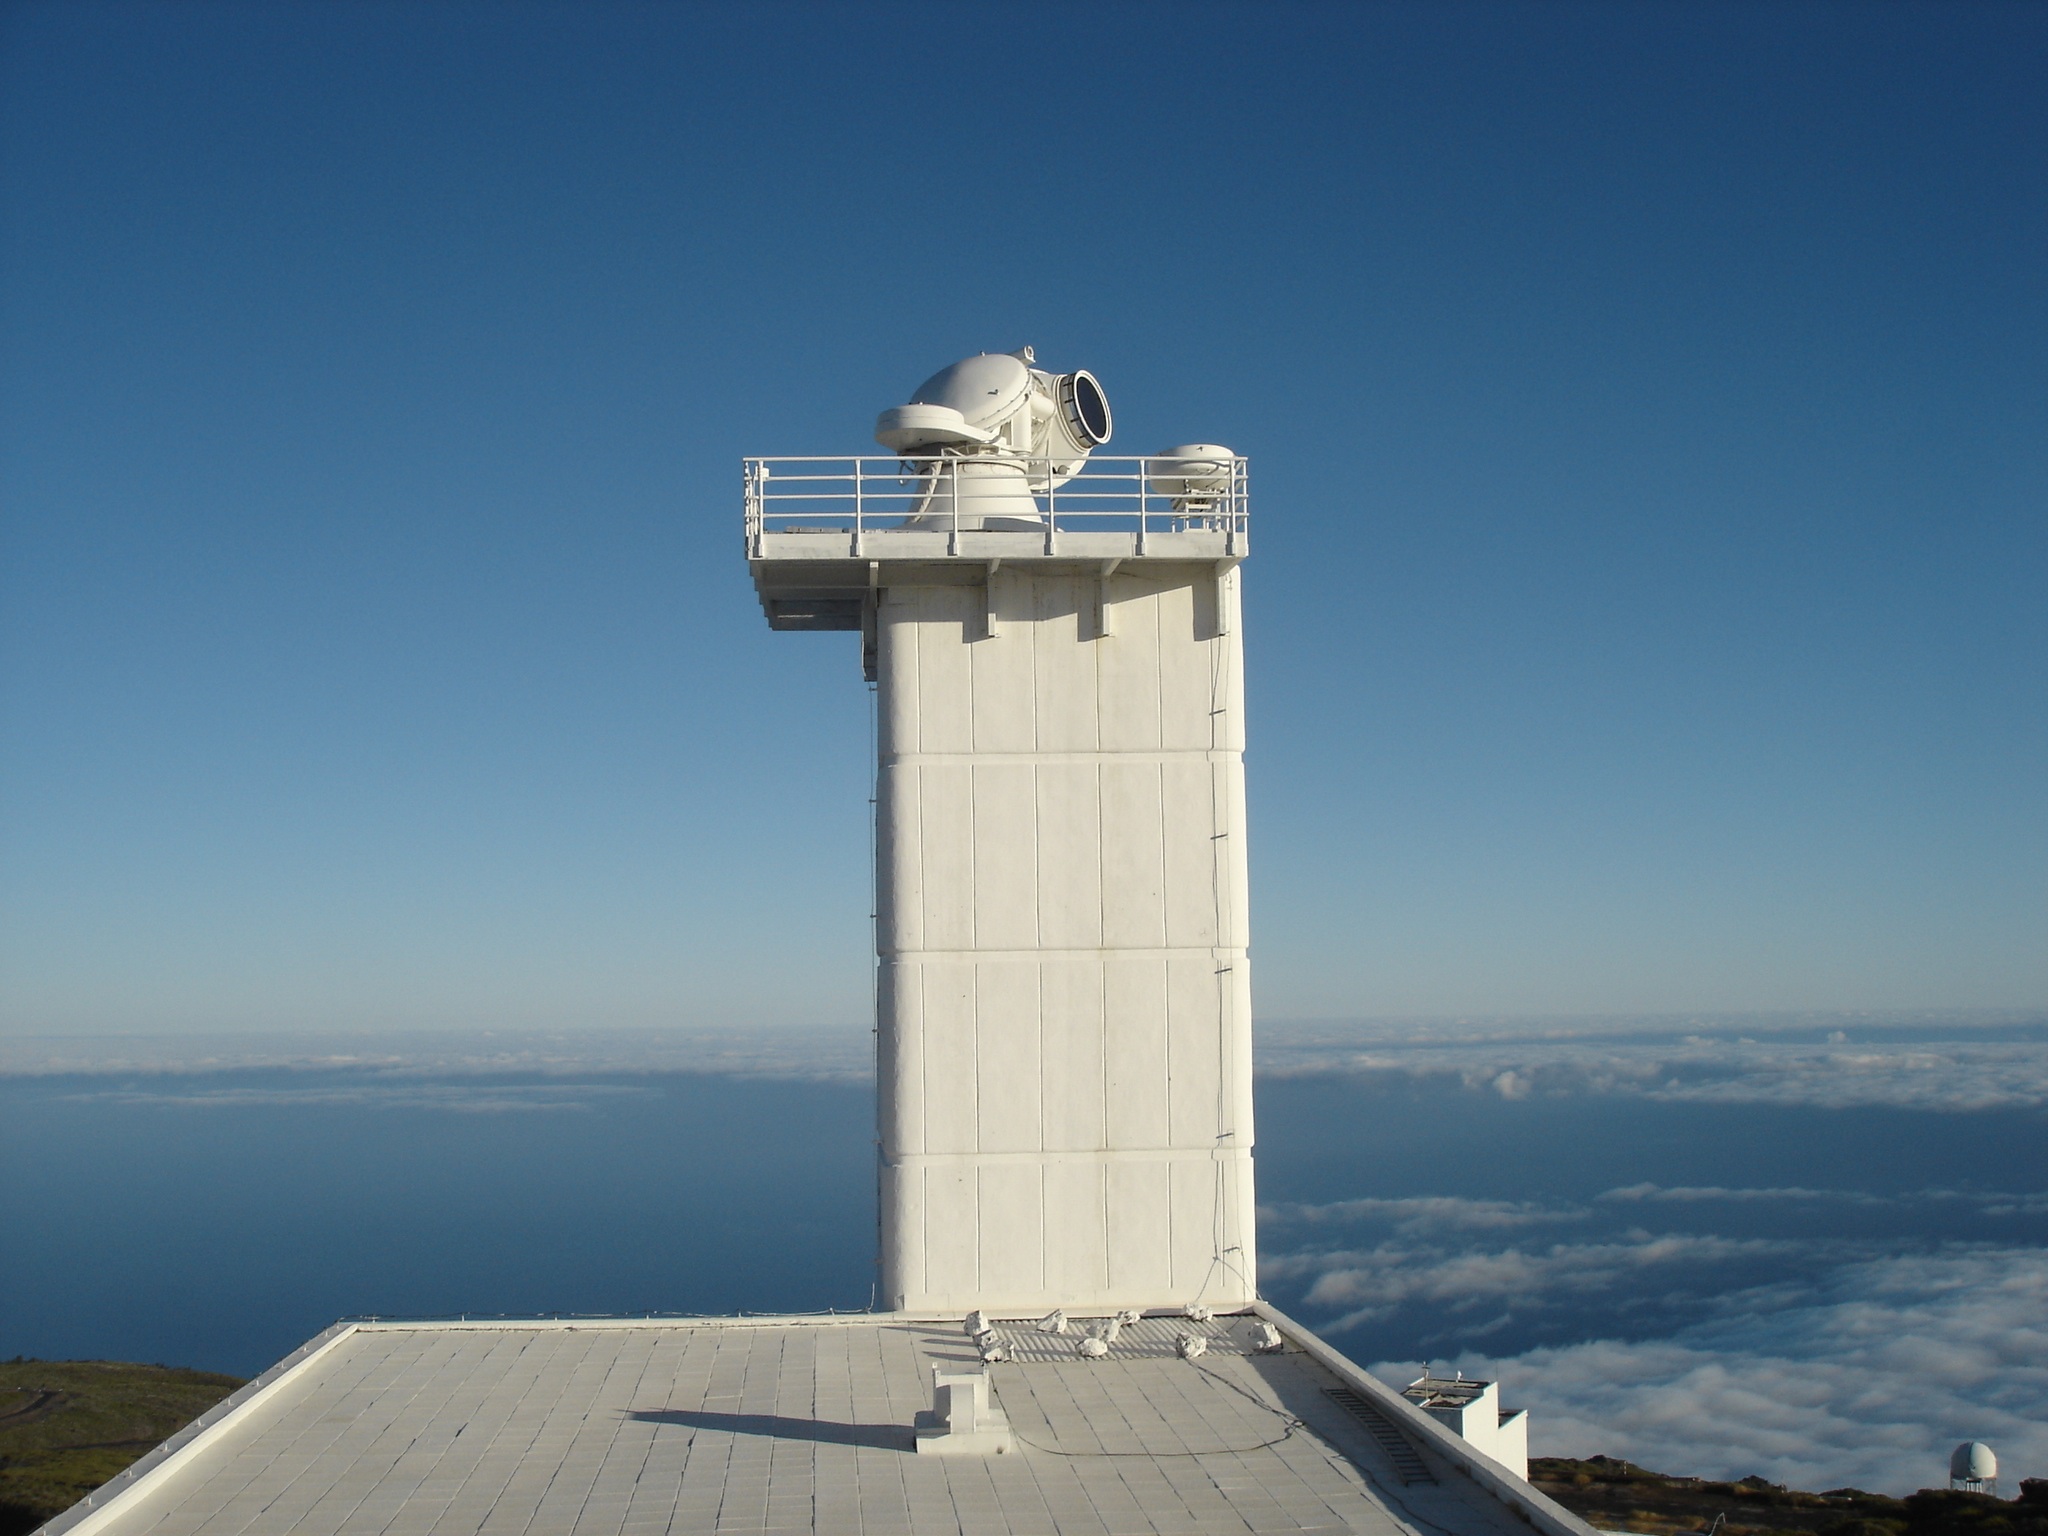 The Swedish 1-m Solar Telescope (SST) on La Palma. The telescope is pointed towards the rising Sun.
Credit: D. Kiselman